 By Splunk May 07, 2020
In the previous part of our blog series, "Monitoring Kubernetes," we covered the basics of Kubernetes architecture and components, as well as various open-source options for collecting monitoring data from a Kubernetes cluster. Read part 1 to get a better understanding of Kubernetes components and open-source tools for collecting Kubernetes metrics. Here, we’ll review how you can collect and visualize key Kubernetes metrics in Splunk Infrastructure Monitoring.
End-to-End Visibility for Microservices on Kubernetes
Splunk Infrastructure Monitoring integrates with every layer of your environment to provide end-to-end observability for Kubernetes environments:
- The Splunk Smart Agent deploys as a DaemonSet in your kubernetes cluster and collect high-resolution, real-time metrics from Docker, Kubernetes, the underlying hosts, and the services in your containers.
- Smart Agent automatically discovers the microservices running in containers and configures metrics for supported Splunk integrations, giving immediate visibility into your environment.
- Charts and alerts in Splunk update in seconds so they can more accurately track the dynamic behavior of Kubernetes Pods.
- Splunk Application Performance Monitoring (APM) enables directed troubleshooting of microservices, guiding you from an alert to the root cause of issues by correlating metrics and traces across the stack.
Collecting Kubernetes Metrics with Splunk
Integrating with a Cloud Provider
For basic monitoring of a Kubernetes cluster managed by a cloud provider, Splunk Infrastructure Monitoring can integrate directly with services like AWS CloudWatch and Google Stackdriver to collect data. This is relatively straightforward and lets you collect Kubernetes metrics without having to install an agent. However, these services are typically configured by default to report metrics at relatively infrequent intervals (typically every 5 minutes), and don’t necessarily provide insight into the specific services deployed on your Kubernetes clusters.
Collecting from Prometheus Exporters
Prometheus is a fairly common starting point for people who want to get visibility into their Kubernetes metrics. Splunk can scrape metrics from a Prometheus exporter endpoint, making it incredibly easy to send metrics to Splunk if you already have exporters deployed in your Kubernetes cluster.
Splunk Infrastructure Monitoring also automatically changes Prometheus metric types to their equivalents in Splunk, and converts Prometheus labels into Splunk dimensions so that you can continue to easily group and filter Kubernetes metrics with metadata.
Using the Splunk Smart Agent
The Splunk Smart Agent is our open-source metrics collection agent. Built around collectd, the Smart Agent discovers services running in your Kubernetes environment, and will automatically configure monitoring content for those dashboards. The Smart Agent runs as a daemonset (a copy per node in your Kubernetes cluster), with each instance of the Smart Agent monitoring services running on those same nodes.
Additionally, the Smart Agent has the ability to report metrics at up to 1-second resolution, making it particularly suited for the ephemeral and dynamic nature of Kubernetes environments.
Installing the agent requires just three steps:
- Store a Splunk Access Token as a Kubernetes Secret
- Configure the Kubernetes daemonset and Splunk Smart Agent to work with your cluster
- Run commands on your Kubernetes cluster to install the Smart Agent and start streaming metrics into Splunk
First, store a Splunk Access Token as a key named access-token in a Kubernetes secret named signalfx-agent, using the following command:
$ kubectl create secret generic --from-literal access-token=MY_ACCESS_TOKEN signalfx-agent
To configure the Kubernetes daemonset and Spljunk Smart Agent to work with your cluster and automatically discover Splunk-supported integrations to monitor, you’ll need to download and modify a number of .yaml files from our Github repository to the machine you usually run "kubectl" from:
- daemonset.yaml (Kubernetes daemonset configuration)
- configmap.yaml (Splunk agent configuration)
- serviceaccount.yaml (Splunk service account)
- clusterrole.yaml (Splunk cluster role)
- clusterrolebinding.yaml (Splunk cluster role binding)
Once you’ve modified these according to the instructions in our documentation, run the following commands on your Kubernetes cluster to install the Smart Agent, making sure to include the path to each .yaml file you downloaded and modified:
$ kubectl create -f configmap.yaml \

                 -f daemonset.yaml \

                 -f serviceaccount.yaml \

                 -f clusterrole.yaml \

                 -f clusterrolebinding.yaml  # BE SURE TO CHANGE MY_AGENT_NAMESPACE IN THIS FILE FIRST
If you use Helm, simply follow these instructions to add our Splunk Helm chart repository and install the Smart Agent in your cluster.
Verifying Smart Agent Install and Discovering Your Services
The Smart Agent is preconfigured to include most of the integrations that Splunk supports out of the box, and will automatically discover and monitor the microservices running in your containers. Each integration has a default configuration that you can further customize to your environment using rules based on the container image name and service port.
To quickly see what services an instance of the Smart Agent has discovered, run the command "signalfx-agent stats endpoints" .
Navigating Your Kubernetes Environment
Use the Infrastructure Navigator to get an immediate view of your entire Kubernetes architecture, colored by critical health metrics. Dashboards are populated with metrics emitted from the Smart Agent’s kubernetes-cluster and kubelet-stats monitor, but you can also quickly drill down and across elements of your environment, from the infrastructure to the orchestrator, containers, and applications.
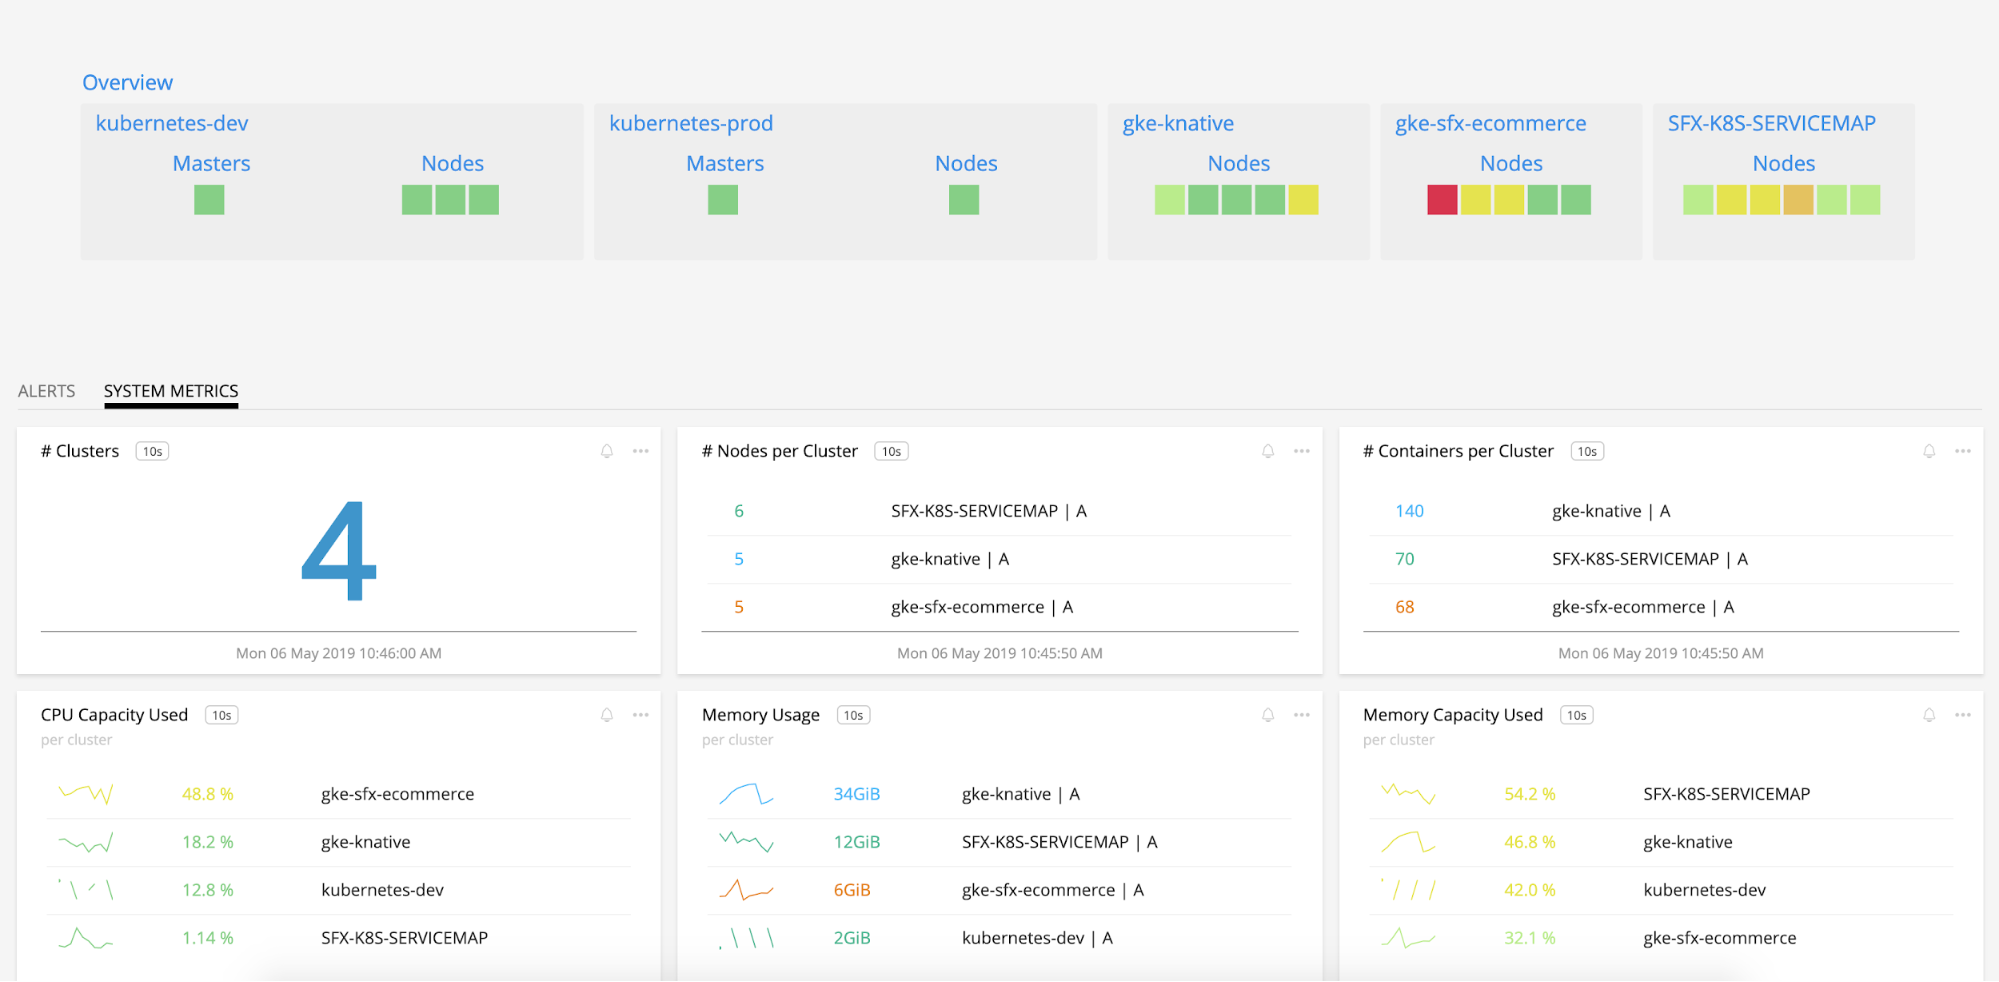
Overview
The Kubernetes Overview provides a heatmap of every Kubernetes cluster you are monitoring in Splunk Infrastructure Monitoring, as well as a dashboard showing the number of clusters, nodes and containers for each, and aggregated system metrics (CPU, disk, memory, network) across all of these nodes.
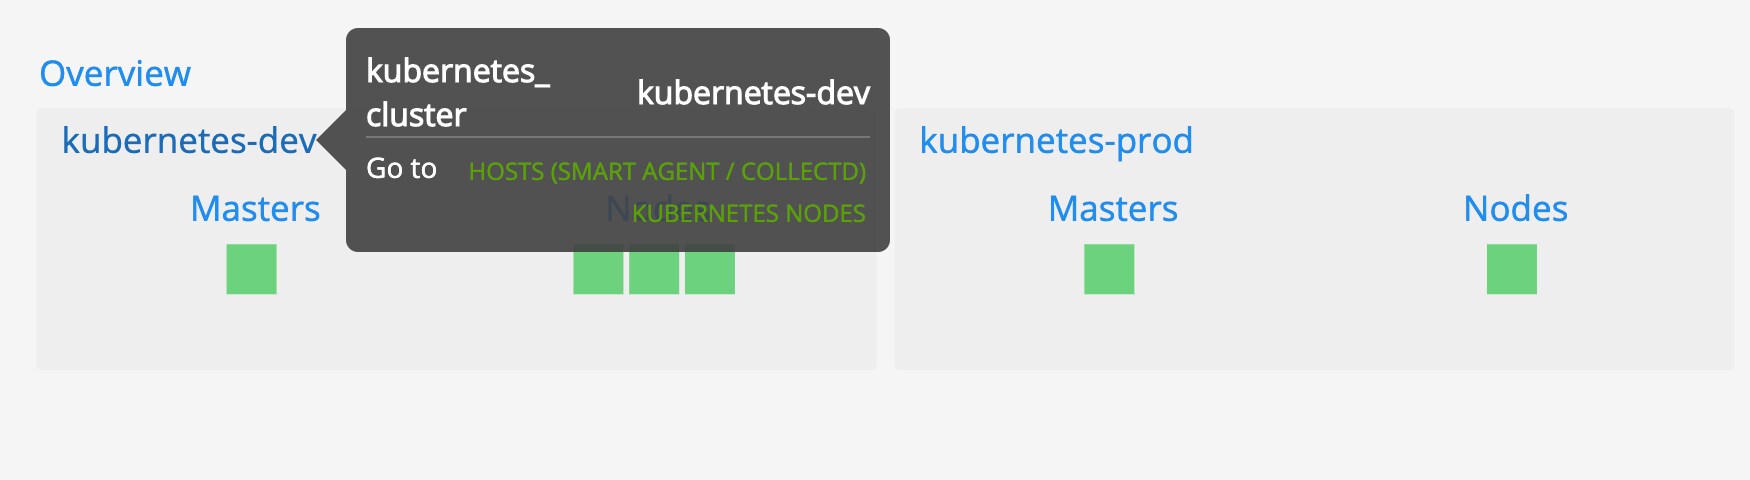
Hovering over the cluster name highlights related resources or views that you can quickly navigate to:
Node View
You can also view your nodes together, instead of grouping them by the cluster they’re a part of – this view lets you assess the health of the infrastructure supporting your Kubernetes cluster.
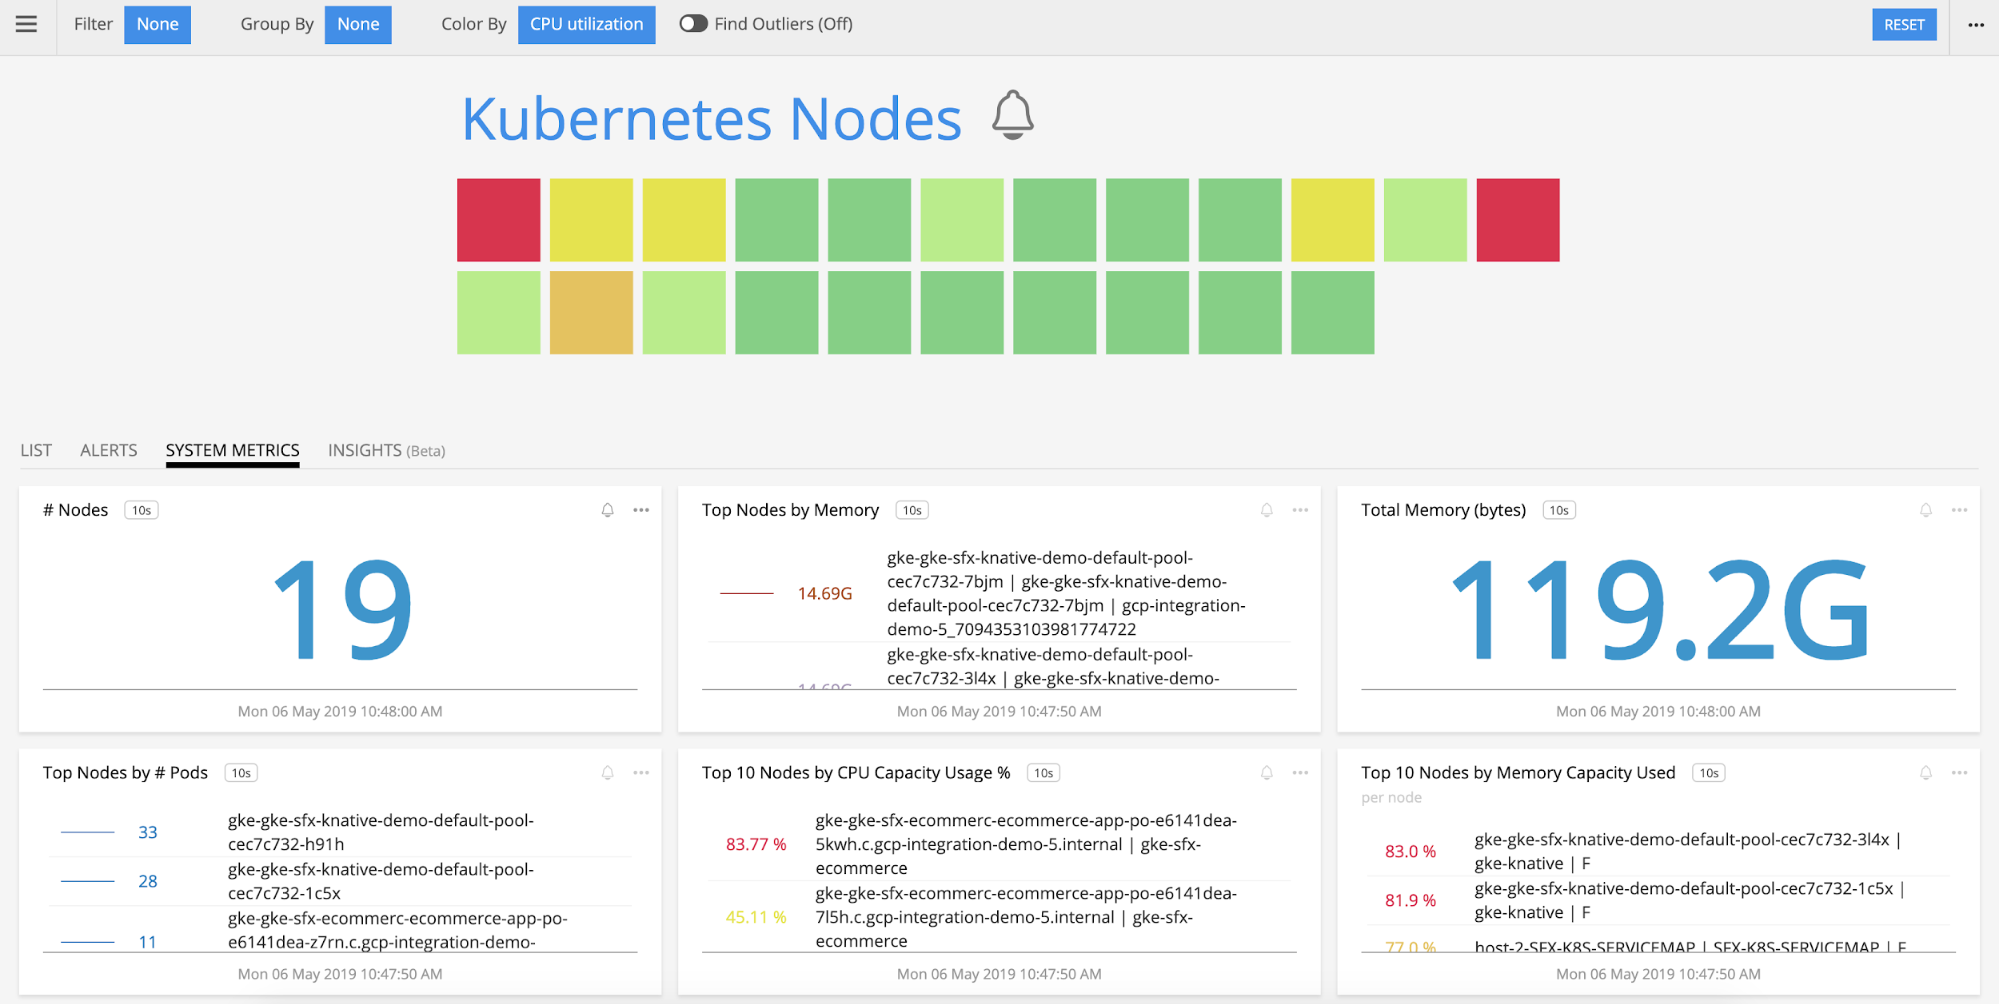
As with Overview, the heatmap is colored by one of several key metrics (CPU Utilization is the default), and you can hover over a node to see additional data or drill down.
Pod View
Selecting Kubernetes Pods shows all of the pods running in your Kubernetes clusters. You can track activity across a particular pod or across all pods, using the same dynamic filtering and grouping in the Nodes view.
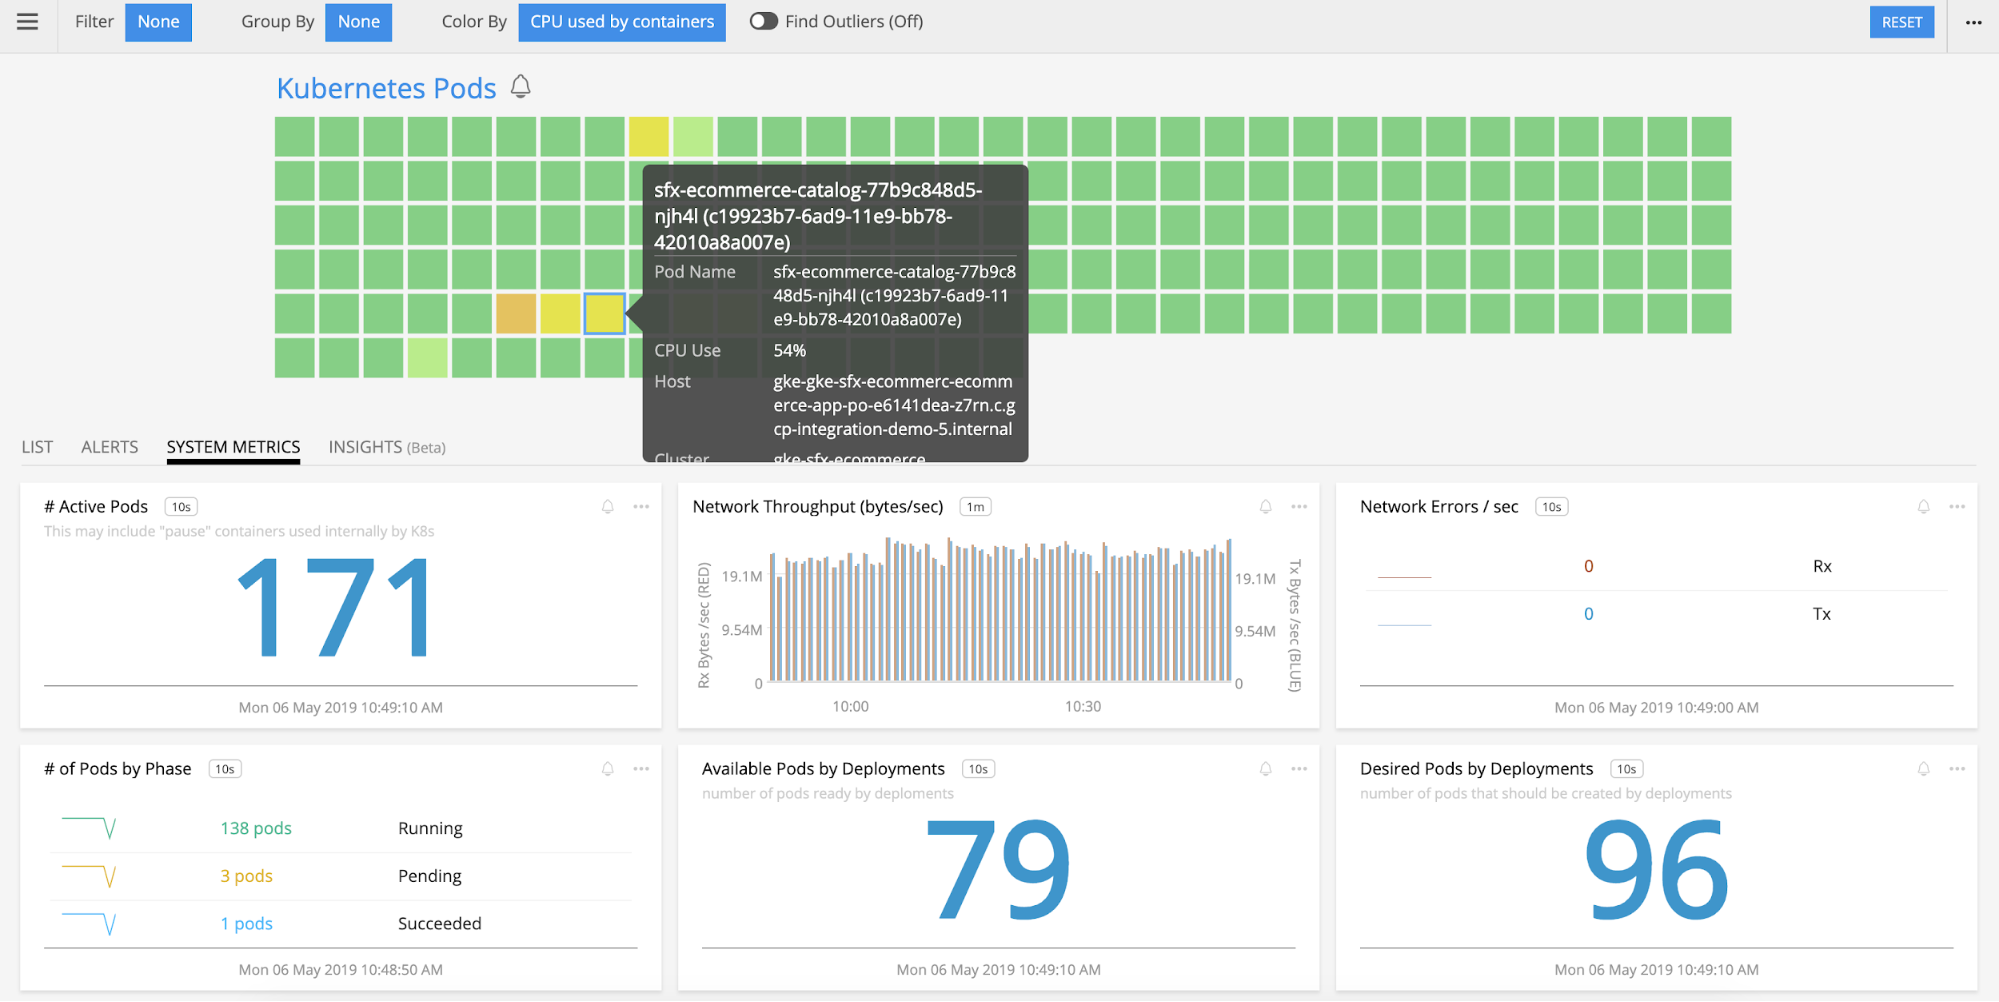
From any of the individual pods in this view, you can drill down to the Docker containers, navigate to the Kubernetes node hosting that pod, or view the node in other contexts.
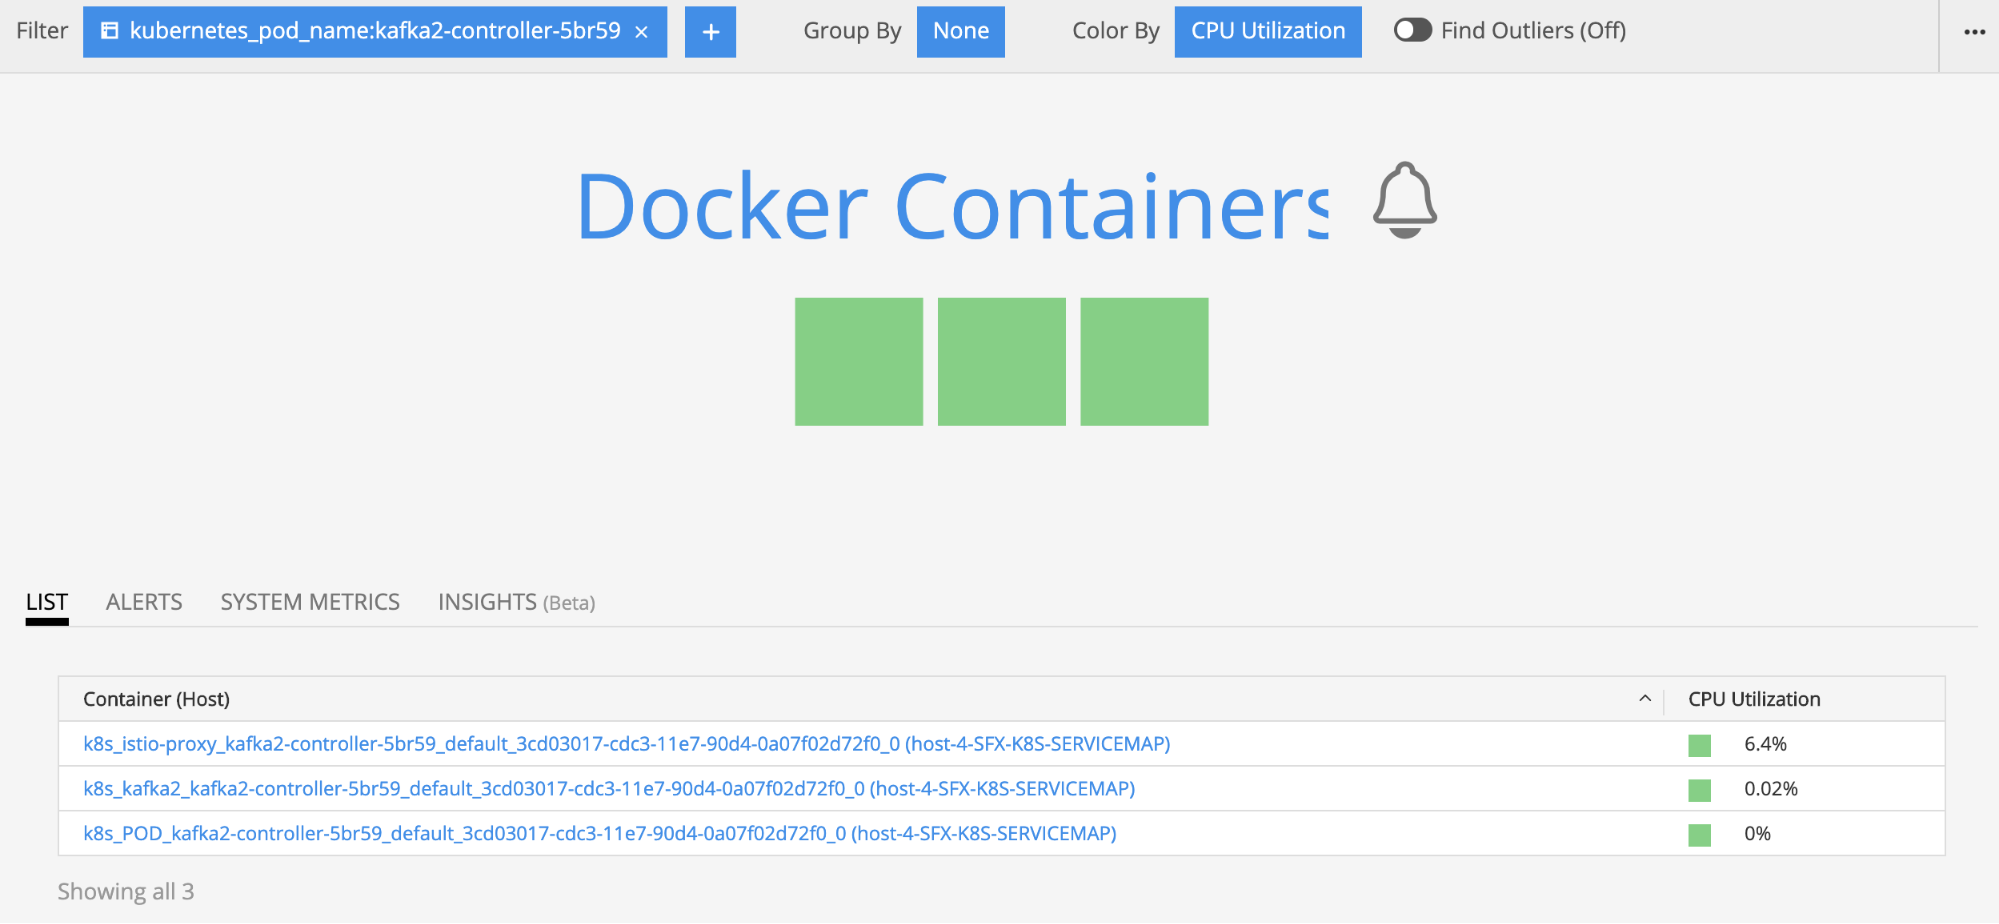
Docker Containers View
This shows each of the Docker containers reporting to Splunk from your environment.
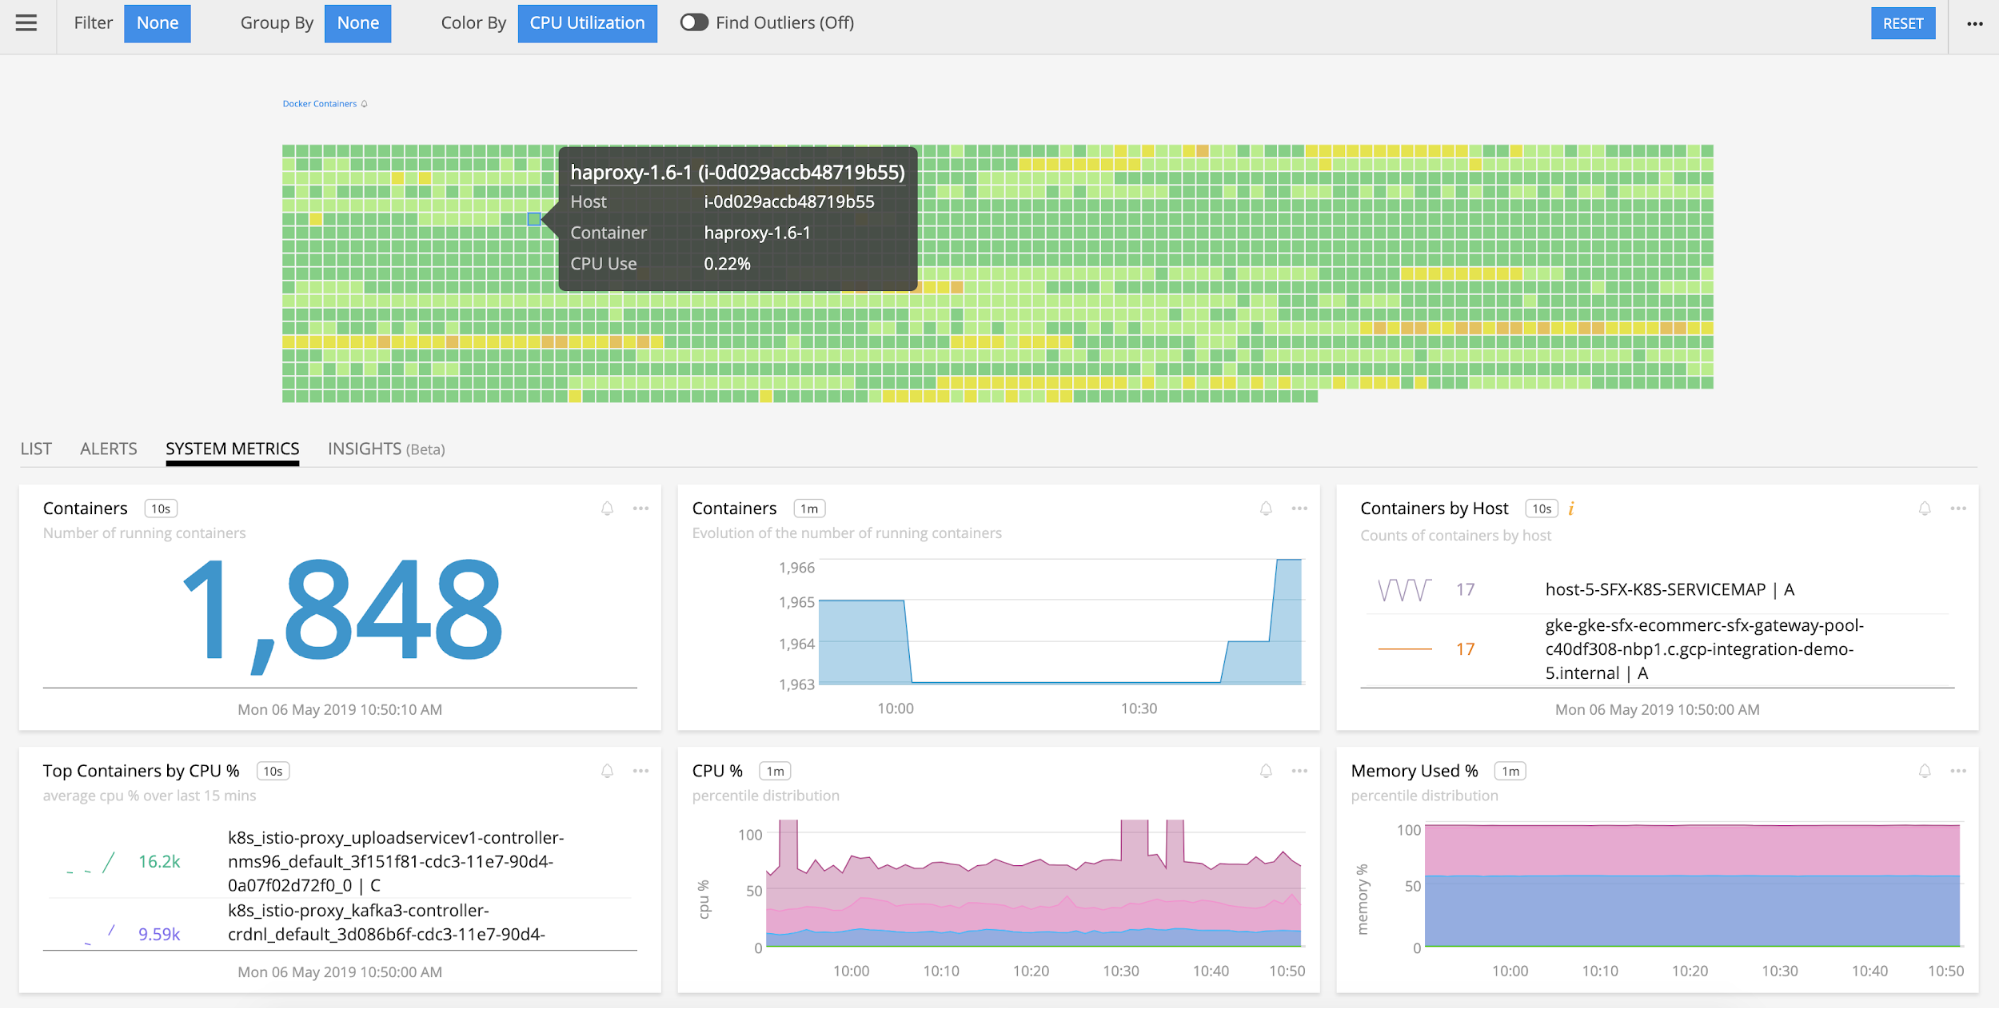
Navigating here from the Pod view will show just the containers in a single pod, but you can also group and filter your containers by Kubernetes-related dimensions.
Start Monitoring Kubernetes
Kubernetes has emerged as the de-facto standard for orchestrating containerized microservices, but presents new monitoring requirements. Splunk delivers real-time visibility into Kubernetes clusters and the services deployed in them, and provides operators with the ability to respond to issues in real-time.
If you’re not already using Splunk Infrastructure Monitoring, get started with a 14-day trial.
Thanks,
Aaron Sun