 By Splunk May 07, 2020
FThis is the first in a series of blogs on monitoring Kubernetes. Part 1 (this blog) begins with Kubernetes architecture, various sources for monitoring data within Kubernetes, and open source monitoring approaches. Part 2 explains how to monitor Kubernetes using Splunk Infrastructure Monitoring.
About Kubernetes
As organizations are adopting microservices architecture to gain speed, resilience, and scalability, they are increasingly adopting containers to package, distribute and run distributed microservices. According to Gartner, by 2022, more than 75% of global organizations will be running containerized applications in production, which is a significant increase from fewer than 30% today.
Kubernetes has emerged as the de facto standard for container orchestration. With over 51K stars on GitHub and 2,100 contributors spanning every time zone across the globe, Kubernetes enjoys a vibrant community. According to the latest survey by Cloud Native Computing Foundation (CNCF), Kubernetes adoption has been consistently increasing and 83% of respondents cite Kubernetes as their choice for container management.
In this blog, we will discuss various monitoring approaches and best practices to design an end-to-end observability strategy for Kubernetes workloads.
Understanding Kubernetes Objects
Kubernetes is a system that assembles a group of machines into a single unit that can be consumed via an API. Kubernetes further segments those compute resources into two groups: Worker Nodes, and Master Node(s).
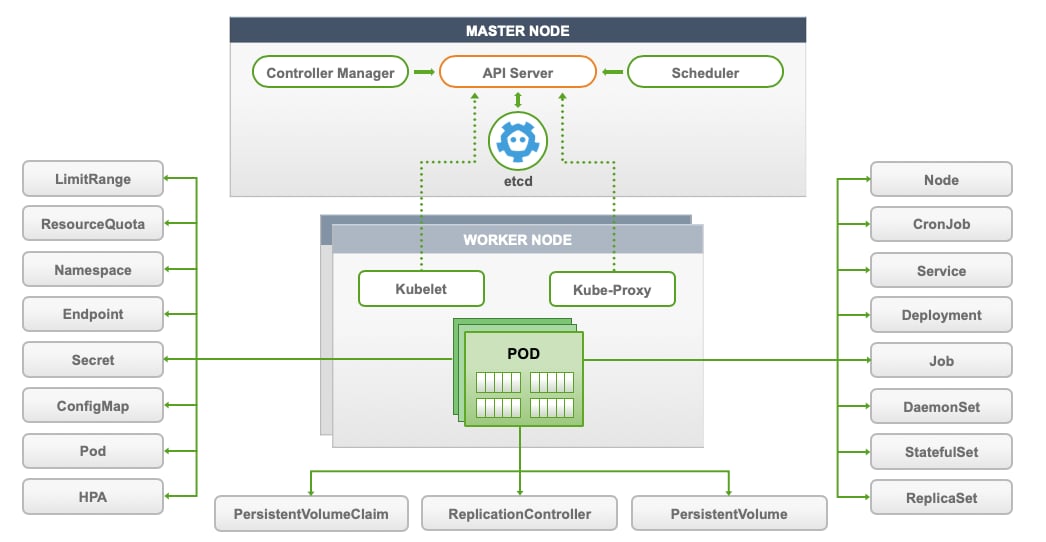
Kubernetes consists of persistent entities called Kubernetes Objects which represent the state of Kubernetes cluster. These objects include:
- Containerized applications that are deployed on the cluster and associated nodes
- The resources available to those applications
- The policies around how those applications behave, such as restart policies, upgrades, and fault-tolerance
Monitoring in Kubernetes Environments
The biannual CNCF survey cites monitoring as one of the top challenges in successfully adopting Kubernetes. However, traditional monitoring tools are unsuitable for measuring the health of cloud-native applications and infrastructure. As Gartner notes:
"Historically, monitoring tools have focused on host-level metrics, such as CPU utilization, memory utilization, input-output (I/O) per second, latency and network bandwidth. Although these metrics are still important for operations teams, by themselves they won’t paint a full picture, because they lack granular detail at the container or service level."
The monitoring strategies of yore do not work in the cloud-native era primarily because:
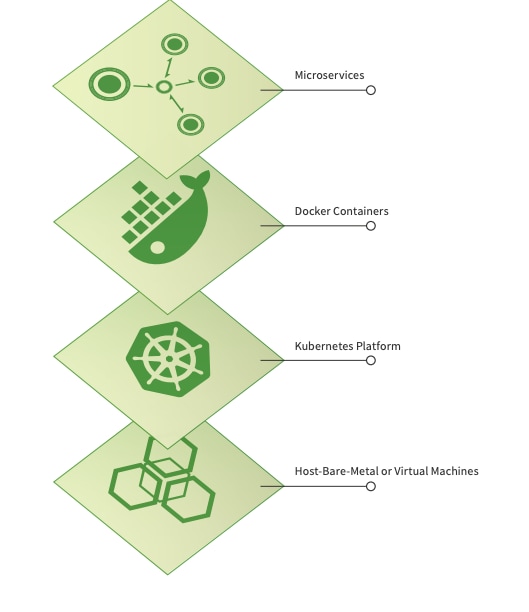
There Are More Components to Monitor
In the monolithic world, there are only two components to monitor — applications and the hosts on which the applications were deployed. In the cloud-native world, containerized applications orchestrated by Kubernetes have multiple components that require monitoring:
- Hosts
- The Kubernetes platform itself
- Docker containers
- Containerized microservices
Container Ephemerality and Unpredictable Pod Placement
Unlike the traditional long-running host model, modern microservices-based applications are typically deployed on containers which are dynamic and ephemeral. Kubernetes ensures that the desired number of application replicas are running. Kubernetes will place the pods on whichever nodes it deems fit, unless specifically instructed not to do so via node affinity or taints. In fact, letting Kubernetes schedule pods is the key design goal for this self-adjusting system.
Traditional monitoring approaches do not work in these highly-dynamic environments because they typically follow long-running hosts using host names or IP addresses. For containerized environments, monitoring tools must provide immediate service discovery and automatically detect the lifecycle events of containers, while also adjusting metric collection as containers are spun up or restarted in seconds
Monitoring the Performance of Microservices
Pinpointing issues in a microservices environment is more challenging than with a monolithic one, as requests traverse both between different layers of the stack and across multiple services. Modern monitoring tools must monitor these interrelated layers while also efficiently correlating application and infrastructure behavior to streamline troubleshooting
Open-Source Options for Monitoring Kubernetes
DevOps teams typically first start with the built-in monitoring options that come with a standard Kubernetes deployment. These options include:
- Kubernetes health checks with probes
- cAdvisor
- Metrics API and Metrics Server
- The Kubernetes Dashboard
- Kube-state-metrics
- Prometheus metrics
Probes
Using Kubernetes Liveness probe, Kubernetes will execute a liveness command within the pod with a predefined frequency. Below is a simple example from Kubernetes docs of liveness probe by running cat command.
While probes provide simplistic checks at a moment of time, they lack sophisticated performance analytics capabilities as well as persistence for historical trends.
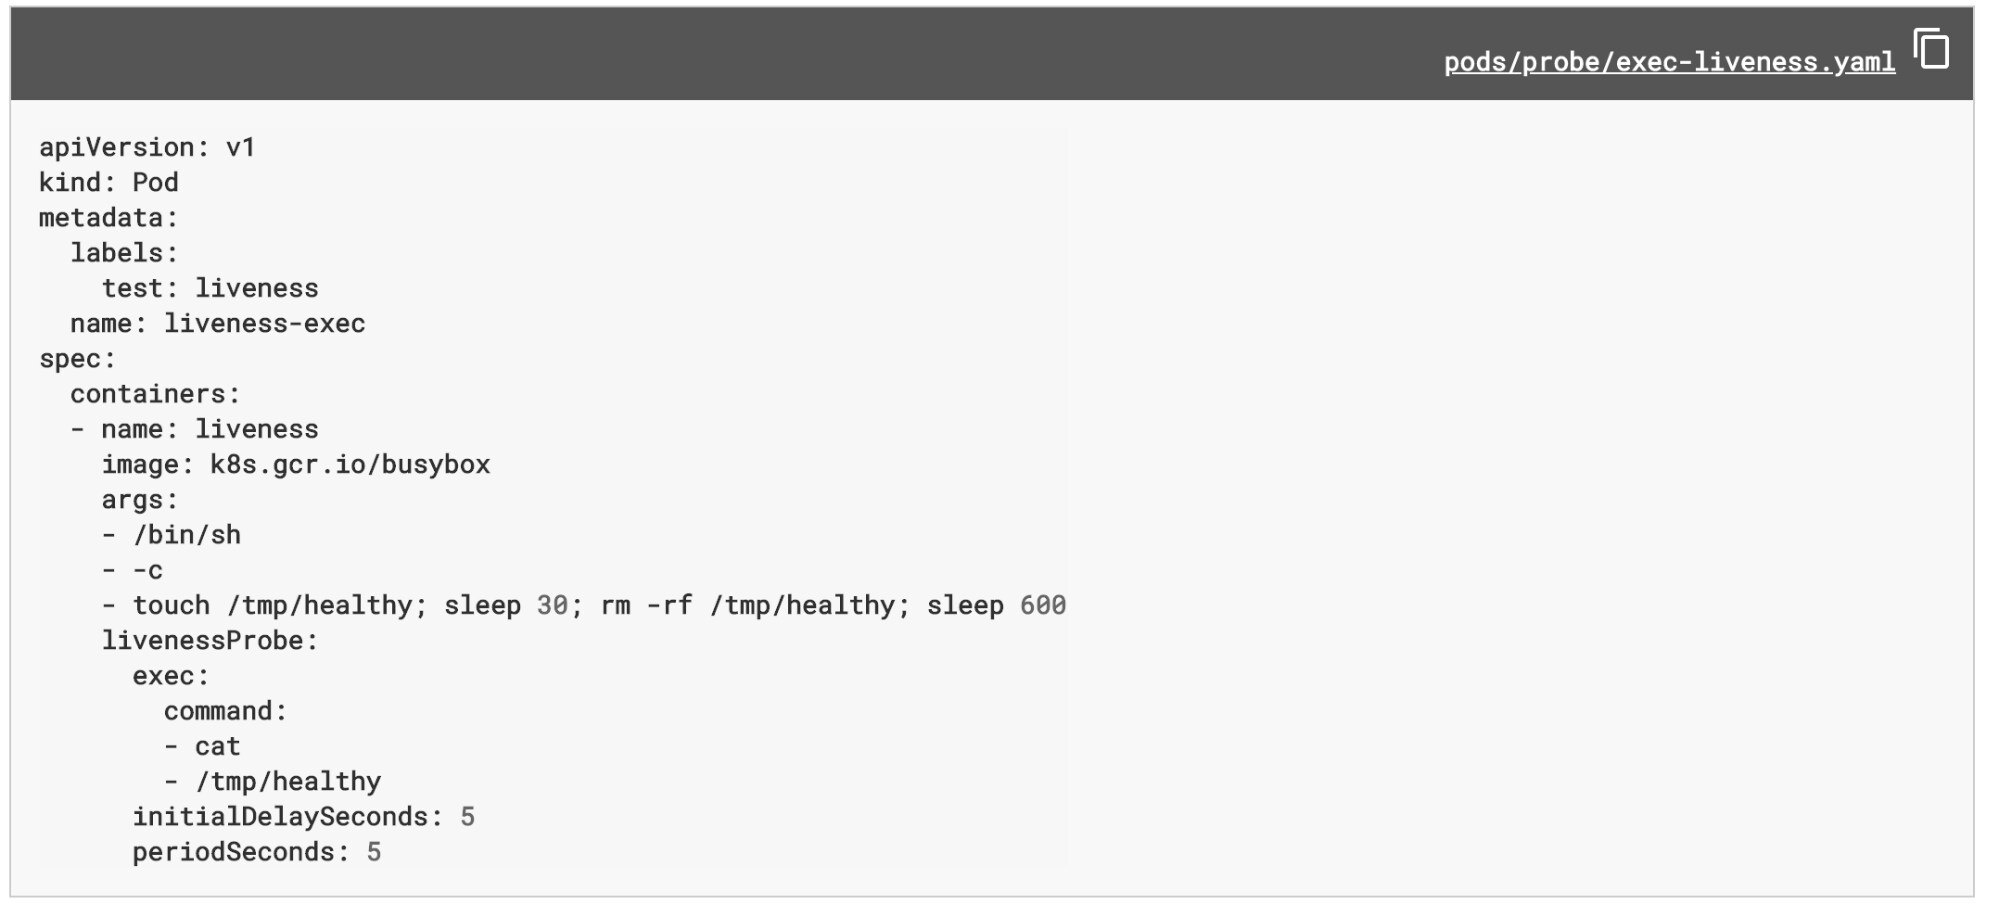
Readiness probes are conducted by Kubernetes to know when a Container is ready to start accepting traffic.
cAdvisor
cAdvisor is an open source container resource usage and performance analysis agent. It is purpose built for containers and supports Docker containers natively. In Kubernetes, cAdvisor is integrated into the Kubelet binary. Hence it runs at every node instead of the pod. cAdvisor auto-discovers all containers in the machine and collects CPU, memory, filesystem, and network usage statistics.
Although cAdvisor provides basic machine-level performance characteristics, it also lacks analytics and persistence to understand trends
Metrics API and Metrics Server
Starting from Kubernetes 1.8, resource usage metrics, such as container CPU and memory, disk usage, are available in Kubernetes through the Metrics API.
Metrics API does not store the value over time – i.e. by calling the API you can find out what is the value of resource utilization now but it cannot tell you what the value was 10 minutes ago.
Inspired by Heapster, which is now deprecated, Metric server makes the resource usage at nodes and pods level via standard APIs the same way the other Kubernetes APIs are accessed.
Metric Server provides performance data via APIs and can be configured to persist the data over time, however, it lacks analytics and visualization capabilities.
Kubernetes Dashboard
Kubernetes Dashboard provides basic UI to get resource utilization information, manage applications running in the cluster as well as to manage the cluster itself.
Kubernetes Dashboard can be accessed with the following command:
$ kubectl apply -f https://raw.githubusercontent.com/kubernetes/dashboard/v1.10.1/src/deploy/recommended/kubernetes-dashboard.yaml
To access Dashboard from your local workstation you must create a secure channel to your Kubernetes cluster. Run the following command:
$ kubectl proxy
Kubernetes Dashboard can now be accessed here.
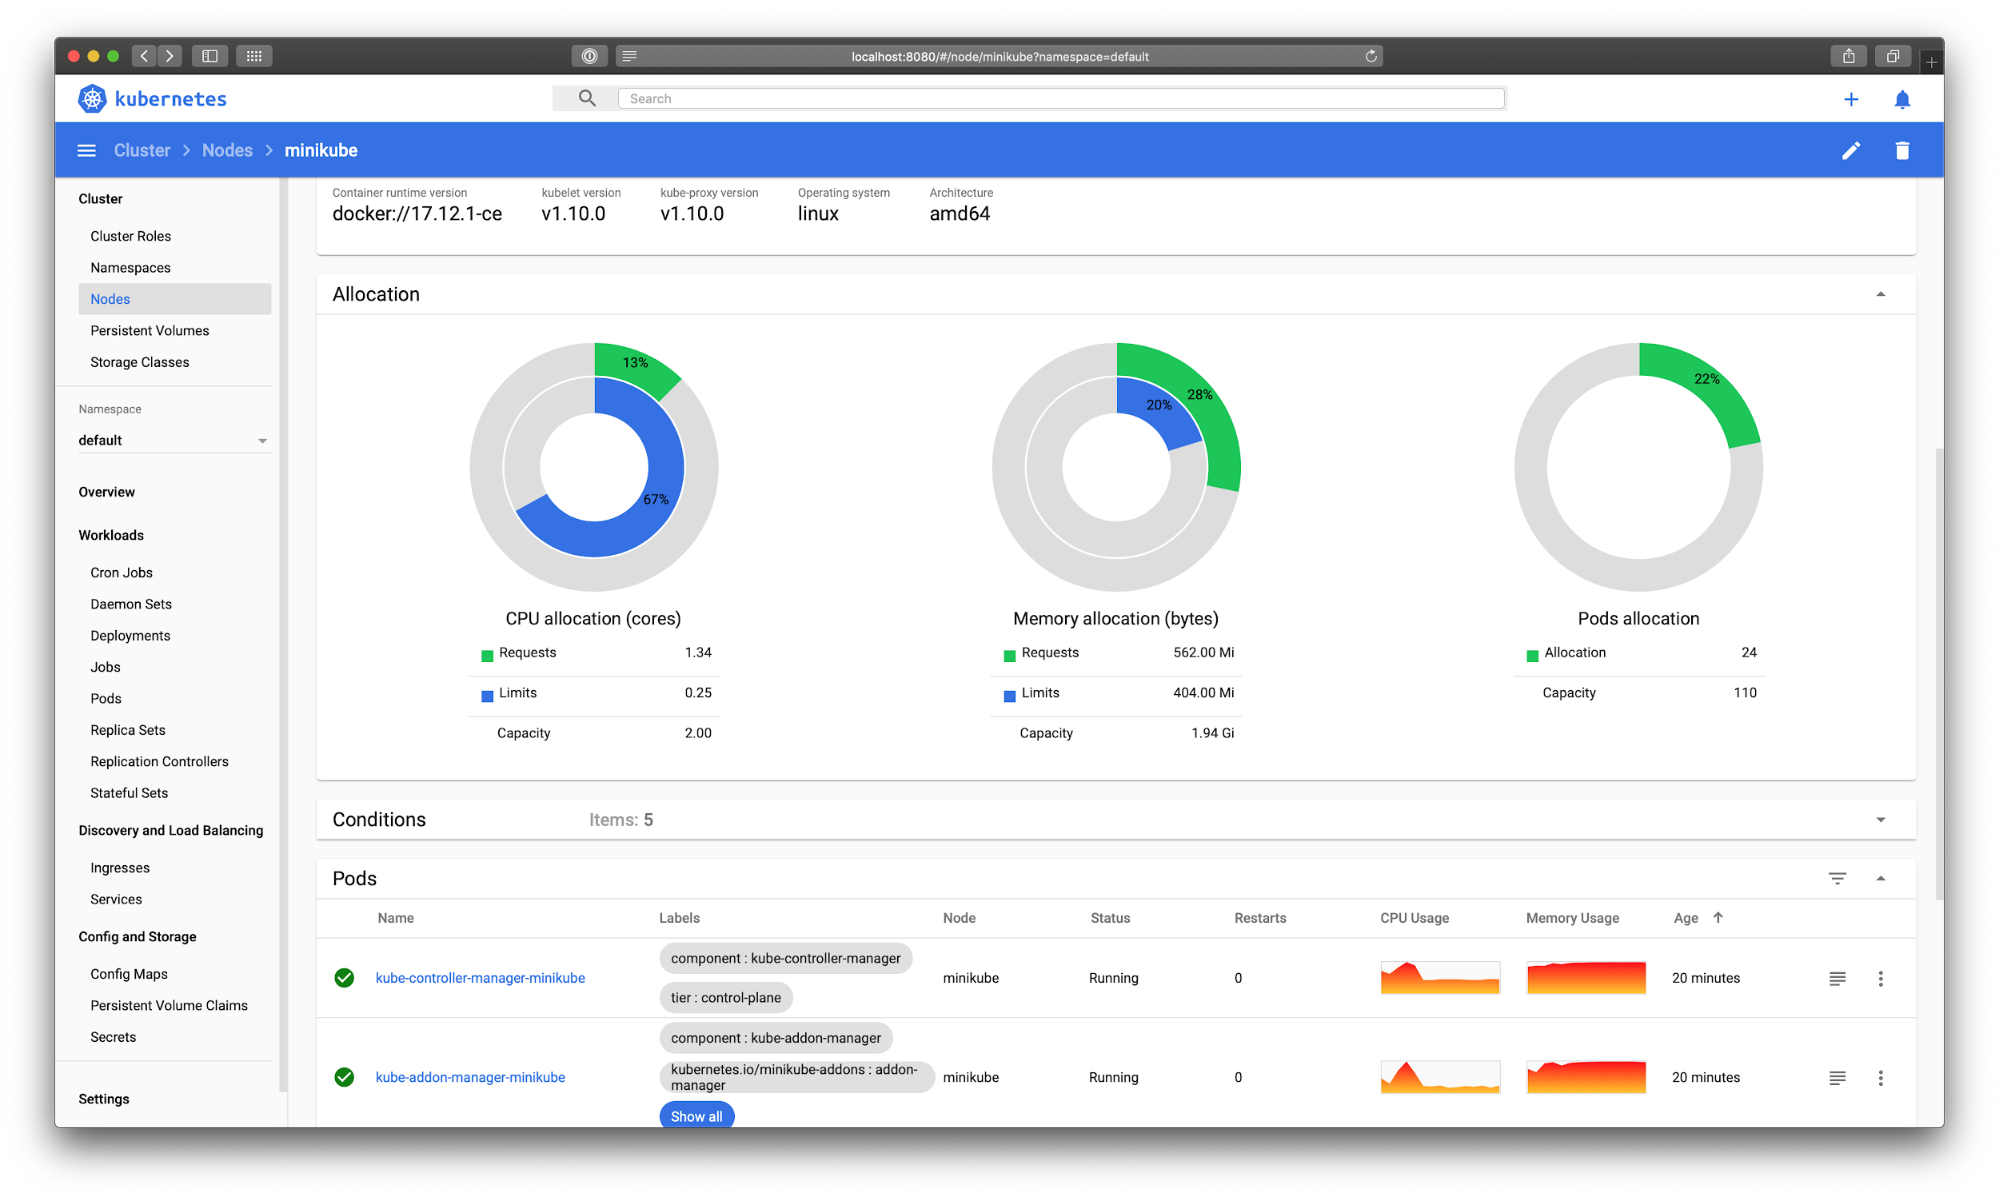
While Kubernetes dashboard provides basic visualization, it depends on Heapster, which is now deprecated.
Kube-state-metrics
Typically used in conjunction with Heapster, Kube-state-metrics is a simple service that listens to the Kubernetes API server and generates metrics about the state of the objects such as Deployment, Node, PersistentVolume, Pod, Service, etc. a full list of all exposed metrics is available here.
Kube-state-metrics provides the information in the raw plain text form and provides an end-point to scrape the metrics. DevOps teams would need to bring their own metrics storage, visualization, and alerting tools to make data from Kube-state-metrics actionable.
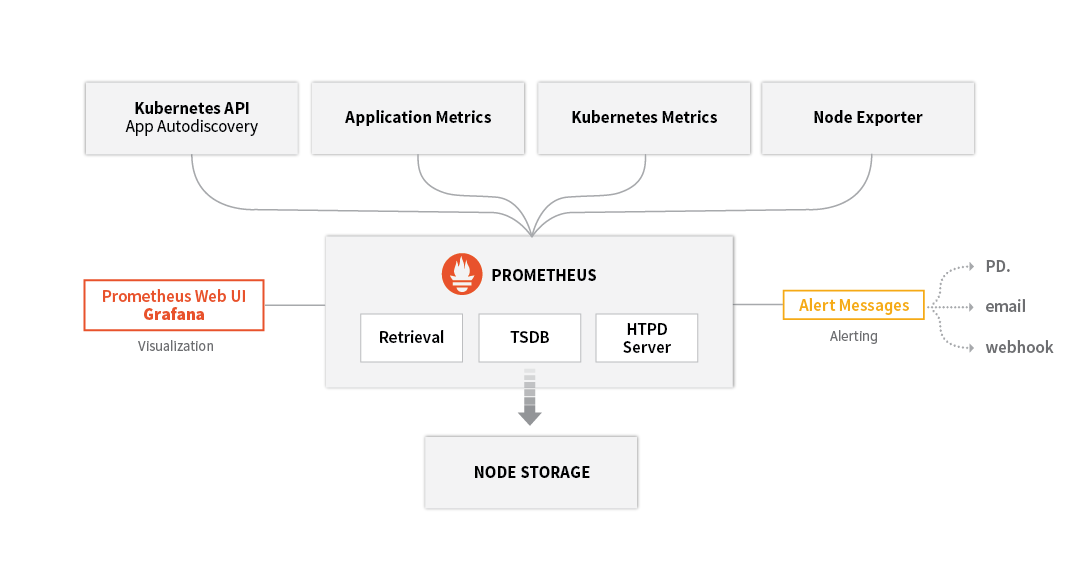
Prometheus
Prometheus provides a way to get end-to-end visibility into your Kubernetes environments. Prometheus monitoring system is however much more than just the Prometheus time series database – to get complete visibility, you will need to install and maintain the entire Prometheus monitoring system as shown below:
Challenges with Prometheus
While it is easy to get started with Prometheus in dev, test environments, teams quickly realize that by default Prometheus lacks enterprise-grade features to monitor mission-critical workloads in production and at scale. Primarily, the challenges are:
- Visualization: Additional tools such as Grafana are needed for visualization
- Authentication, and Authorization: Prometheus and its components do not provide any server-side authentication, authorization or encryption. If you require this, it is recommended to use a reverse proxy.
- Local file storage: Prometheus by default is a local on-disk time series database, but it also optionally integrates with remote storage systems with the support of 3rd party adapters
- Lack of end-to-end troubleshooting: Prometheus does not provide end-to-end visibility and troubleshooting capabilities by tracing transactions across distributed services
Up Next: Monitoring Kubernetes Environments with Splunk Infrastructure Monitoring
The next blog in this series will focus on how to get end-to-end visibility into Kubernetes environments as well as directed troubleshooting with Splunk Infrastructure Monitoring. If you are new to Splunk Infrastructure Monitoring, get started by signing up for a free trial.